
See Part 1 of this series to find out what I knew about my family background before having the DNA test done.Last year, individual ancestry reports via DNA analysis became available in Australia through AncestryDNA. I don't know very much about my ancestry and have always wanted to know more, so as soon as I heard about them, I very much wanted to have the report done.
The details of collecting the sample are slightly unsavoury, so I didn't take any photos. I received a kit with a tube in it, which I had to spit into until it reached a certain level. Then I sealed the tube into a bag and sent it back using the provided post satchel. After approximately 5 weeks, I received an email notifying me that my results were available and ready to see on the ancestry.com website.
WHAT THE REPORT SHOWED
Here is the summary graph of my DNA analysis:

Looking at the summary results, I could only come to the conclusion that I'm not what I thought I was. When I emailed the results to my Mum, I think she was a little shocked. She responded "after all you are 50% Dutch and as far as I know, the only mix on that side is some German and Swedish." (I didn't even know about the Swedish part before reading that email!) Surely then, my ancestry should have more Dutch in it and less British? It left me feeling very confused. When I looked further into the results however, I saw that things were much more complicated.
The AncestryDNA test compared my DNA to that of 3,000 samples from 26 regions in the world, and these were the results (most likely result is in brackets):
EUROPE: 98%
Great Britain: 40-96% (67%)
Ireland: 0-30% (14%)
Scandinavia: 0-25% (9%)
(The following were listed under "low confidence regions")
EUROPE: cont.
European Jewish: 0-5% (2%)
Italy/Greece: 0-5% (2%)
Western Europe: 0-9% (< 1%)
Finland/Northwest Russia: 0-3% (< 1%)
Iberian Peninsula: 0-2% (< 1%)
Eastern Europe: 0-3% (< 1%)
WEST ASIA: Caucasus: 0-3% (< 1%)
SOUTH ASIA: India and Surrounds: 0-1% (< 1%)

As you can see from the percentages above, the results are both very vague and very specific at the same time. Many of the results have a range starting from zero. This happens because my DNA is chopped into 40 pieces and each piece is analysed separately. So, for example, some pieces had anywhere up to 96% Great British DNA, but none had less than 40%. At least one piece had zero Scandinavian DNA, and the rest anywhere up to 25%, but the average amount was 9%.
Any region that has less than 15% maximum and 4.5% average is listed under "low confidence". This means that I am much less likely to have DNA from these groups than I do from the higher-percentage groups. These regions are shown on the map as a ring rather than a solid circle:

In my report, extensive information about each region can be found by clicking on it. There is a map, and illustrated information about the history of the area, similar to a Wikipedia page. Probability is also plotted on these maps in the form of concentric rings. For example, here is the map for the Great Britain region:

There are 3 concentric circles on the map, reflecting the area that people from this region come from. The probability is highest that people in this DNA group come from the central area. The probability is lower the further out you go. Note that the second ring on the Great Britain map covers the Netherlands, Belgium and northern France.
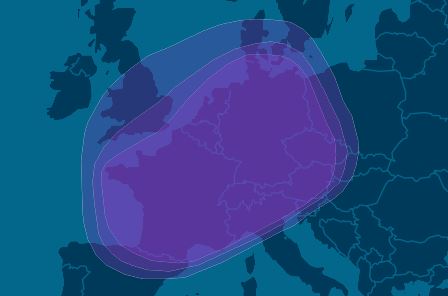
The map for Western Europe (above) also covers the Netherlands area. So, there's a possibility that I could have Dutch DNA heritage from either of these regions ... or none. And where did the Caucasus and South Asian DNA come from? Did I have an ancestor that travelled to Europe along the Silk Road? It was an exciting thought, but I'll never know the answer.
Other, more sobering thoughts came to me as well. What if I don't have as much Dutch heritage as I thought? Are my Dutch ancestors migrants that came from somewhere else relatively recently? And if so, where did they come from? I never really related to Irish culture much, but I could be up to 30% Irish -- how do I reconcile that? As the website explains, a person can inherit more DNA from one parent than the other ... would I have to acknowledge that more of my DNA comes from the side of my family I don't get along with?
That's the frustrating thing about getting a DNA analysis done. I'll never know for sure. All of the statistics are just probabilities, and statistics can't tell the story of human lives. It niggled at me for a long time. I wondered if the results were correct, if the 40 pieces of DNA were a representative sample. I even wondered if the sample had been contaminated. That's why I eventually decided to get a second opinion.
In the next post, I'll talk about my experience with getting a second test done through a different company: 23andMe.

No comments:
Post a Comment